


线性回归欠拟合与过拟合的情况再实际业务中会非常普遍,这时我们需要用到多项式特征的线性回归来逼近非线性函数。如下图我们看degree不同角度下的拟合情况:当角度为1的时候(高斯分布的线性回归)出现欠拟合的情况,当角度为10的时候出现过拟合的情况。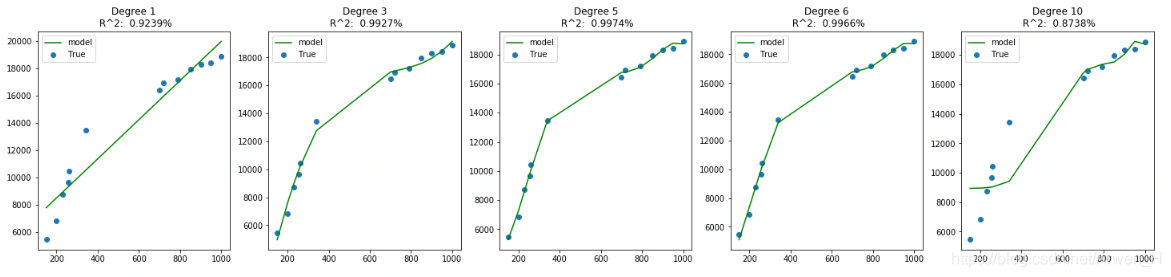
接这用房价与房屋面积这组数据来验证
import numpy as np
import pandas as pd
import matplotlib.pyplot as plt
%matplotlib inline
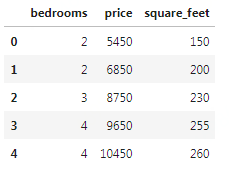
data=pd.DataFrame({'square_feet':[150,200,230,255,260,340,700,720,790,850,900,950,1000],
'price':[5450,6850,8750,9650,10450,13450,16450,16930,17200,17943,18320,18412,18900],
'bedrooms':[2,2,3,4,4,5,6,6,6,7,7,8,9]})
data.head()
from sklearn.pipeline import Pipeline #传递途径
from sklearn.preprocessing import PolynomialFeatures #生成多项式交互功能
from sklearn.linear_model import LinearRegression #最小二乘法线性回归
from sklearn.metrics import r2_score #R2验证
data_train=np.array(data[['square_feet','bedrooms']]).reshape(len(data),2)#不管什么方法将list或DataFrame或Series转化成矩阵就行
data_test=np.array(data['price']).reshape(len(data),1)
a=data_train
b=data['price'].values

degrees=[1,3,5,6,10]
plt.figure(figsize=(25,5))
for i in(range(len(degrees))):
    ax=plt.subplot(1,len(degrees), i + 1)
    polynomial_features=PolynomialFeatures(degree=degrees[i])
    linear_regression=LinearRegression()
    pipeline=Pipeline([('polynomial_features',polynomial_features),('linear_regression',linear_regression)])
    pipeline.fit(a,b)
    score=pipeline.predict(a)
    X_test=a
    r2s=r2_score(b,pipeline.predict(X_test))
    plt.scatter(data.square_feet,b,label='True')
    plt.plot(data.square_feet,pipeline.predict(X_test),c='g',label='model')
   # plt.plot(data.square_feet,b,c='r',label='True')
    plt.title('Degree {}\n R^2:  '.format(degrees[i])+ str(round(r2s,4))+'%')
    plt.legend()
plt.show()
评论区